The following table gives the ages of 50 students of a class. Find the arithmetic mean of their ages.
Age - Years | 16 - 18 | 18 - 20 | 20 - 22 | 22- 24 | 24-26 |
No. of Students | 2 | 7 | 21 | 17 | 3 |
Age in years C.I. | xi | Number of students (fi) | xifi |
16 - 18 | 17 | 2 | 34 |
18 - 20 | 19 | 7 | 133 |
20 - 22 | 21 | 21 | 441 |
22 - 24 | 23 | 17 | 391 |
24 - 26 | 25 | 3 | 75 |
Total | 50 | 1074 |
![]()
The following table gives the weekly wages of workers in a factory.
Weekly Wages (Rs) | No. of Workers |
50-55 | 5 |
55-60 | 20 |
60-65 | 10 |
65-70 | 10 |
70-75 | 9 |
75-80 | 6 |
80-85 | 12 |
85-90 | 8 |
Calculate the mean by using:
(i) Direct Method
(ii) Short - Cut Method
(i) Direct Method
Weekly Wages (Rs) | Mid-Value xi | No. of Workers (fi) | fixi |
50-55 | 52.5 | 5 | 262.5 |
55-60 | 57.5 | 20 | 1150.0 |
60-65 | 62.5 | 10 | 625.0 |
65-70 | 67.5 | 10 | 675.0 |
70-75 | 72.5 | 9 | 652.5 |
75-80 | 77.5 | 6 | 465.0 |
80-85 | 82.5 | 12 | 990.0 |
85-90 | 87.5 | 8 | 700.0 |
Total | 80 | 5520.00 |
![]()
(ii) Short - cut method
Weekly wages (Rs) | No. of workers (fi) | Mid-value xi | A = 72.5 di=x-A | fidi |
50-55 | 5 | 52.5 | -20 | -100 |
55-60 | 20 | 57.5 | -15 | -300 |
60-65 | 10 | 62.5 | -10 | -100 |
65-70 | 10 | 67.5 | -5 | -50 |
70-75 | 9 | A=72.5 | 0 | 0 |
75-80 | 6 | 77.5 | 5 | 30 |
80-85 | 12 | 82.5 | 10 | 120 |
85-90 | 8 | 87.5 | 15 | 120 |
Total | 80 | -280 |
![]()
The following are the marks obtained by 70 boys in a class test:
Marks | No. of boys |
30 - 40 | 10 |
40 - 50 | 12 |
50 - 60 | 14 |
60 - 70 | 12 |
70 - 80 | 9 |
80 - 90 | 7 |
90 - 100 | 6 |
Calculate the mean by:
(i) Short - cut method
(ii) Step - deviation method
(i) Short - cut method
Marks | No. of boys (fi) | Mid-value xi | A = 65 di=x-A | fidi |
30 - 40 | 10 | 35 | -30 | -300 |
40 - 50 | 12 | 45 | -20 | -240 |
50 - 60 | 14 | 55 | -10 | -140 |
60 - 70 | 12 | A = 65 | 0 | 0 |
70 - 80 | 9 | 75 | 10 | 90 |
80 - 90 | 7 | 85 | 20 | 140 |
90 - 100 | 6 | 95 | 30 | 180 |
Total | 70 | -270 |
![]()
(ii) Step - deviation method
Marks | No. of boys (fi) | Mid-value xi | A = 65
| fiui |
30 - 40 | 10 | 35 | -3 | -30 |
40 - 50 | 12 | 45 | -2 | -24 |
50 - 60 | 14 | 55 | -1 | -14 |
60 - 70 | 12 | A = 65 | 0 | 0 |
70 - 80 | 9 | 75 | 1 | 9 |
80 - 90 | 7 | 85 | 2 | 14 |
90 - 100 | 6 | 95 | 3 | 18 |
Total | 70 | -27 |
Here A = 65 and h = 10
![]()
Find mean by step - deviation method:
C. I. | 63-70 | 70-77 | 77-84 | 84-91 | 91-98 | 98-105 | 105-112 |
Freq | 9 | 13 | 27 | 38 | 32 | 16 | 15 |
C. I. | Frequency (fi) | Mid-value xi | A = 87.50
| fiui |
63 - 70 | 9 | 66.50 | -3 | -27 |
70 - 77 | 13 | 73.50 | -2 | -26 |
77 - 84 | 27 | 80.50 | -1 | -27 |
84 - 91 | 38 | A = 87.50 | 0 | 0 |
91 - 98 | 32 | 94.50 | 1 | 32 |
98 - 105 | 16 | 101.50 | 2 | 32 |
105 - 112 | 15 | 108.50 | 3 | 45 |
Total | 150 | 29 |
Here A = 87.50 and h = 7
![]()
The mean of the following frequency distribution is ![]() . Find the value of 'f'.
. Find the value of 'f'.
C. I. | 0 - 10 | 10 - 20 | 20 - 30 | 30 - 40 | 40 - 50 |
freq | 8 | 22 | 31 | f | 2 |
![]()
C. I. | frequency | Mid-value (xi) | fixi |
0-10 | 8 | 5 | 40 |
10-20 | 22 | 15 | 330 |
20-30 | 31 | 25 | 775 |
30-40 | f | 35 | 35f |
40-50 | 2 | 45 | 90 |
Total | 63+f | 1235+35f |

Using step-deviation method, calculate the mean marks of the following distribution.
C.I | 50-55 | 55-60 | 60-65 | 65-70 | 70-75 | 75-80 | 80-85 | 85-90 |
Frequency | 5 | 20 | 10 | 10 | 9 | 6 | 12 | 8 |
Let the assumed mean A= 72.5
C.I | fi | Mid value (xi) | di=xi -; A | fidi |
50-55 | 5 | 52.5 | -20 | -100 |
55-60 | 20 | 57.5 | -15 | -300 |
60-65 | 10 | 62.5 | -10 | -100 |
65-70 | 10 | 67.5 | -5 | -50 |
70-75 | 9 | 72.5 | 0 | 0 |
75-80 | 6 | 77.5 | 5 | 30 |
80-85 | 12 | 82.5 | 10 | 120 |
85-90 | 8 | 87.5 | 15 | 120 |
Total | 80 | -280 |
![]()
Using the information given in the adjoining histogram, calculate the mean.
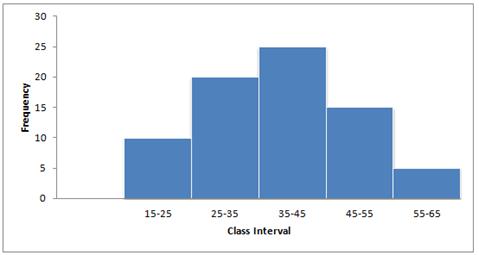
C.I. | Frequency | Mid value x | fx |
15-25 | 10 | 20 | 200 |
25-35 | 20 | 30 | 600 |
35-45 | 25 | 40 | 1000 |
45-55 | 15 | 50 | 750 |
55-65 | 5 | 60 | 300 |
Total | 75 | 2850 |
![]()
If the mean of the following observations is 54, find the value of 'p'.
Class | 0 - 20 | 20 - 40 | 40 - 60 | 60 - 80 | 80 - 100 |
Frequency | 7 | p | 10 | 9 | 13 |
Class | Frequency (f) | Mid Value (x) | fx |
0 - 20 | 7 | 10 | 70 |
20 - 40 | p | 30 | 30p |
40 - 60 | 10 | 50 | 500 |
60 - 80 | 9 | 70 | 630 |
80 - 100 | 13 | 90 | 1170 |
Total | 39 + p | 2370 + 30p |
![]()
Here mean = 54 ..(ii)
from (i) and (ii)

The mean of the following distribution is 62.8 and the sum of all the frequencies is 50. Find the missing frequencies f1 and f2.
Class | 0-20 | 20-40 | 40-60 | 60-80 | 80-100 | 100-120 |
Freq | 5 | f1 | 10 | f2 | 7 | 8 |
Class | Freq (f) | Mid value | fx |
0-20 | 5 | 10 | 50 |
20-40 | f1 | 30 | 30f1 |
40-60 | 10 | 50 | 500 |
60-80 | f2 | 70 | 70f2 |
80-100 | 7 | 90 | 630 |
100-120 | 8 | 110 | 880 |
Total | 30+f1+f2 | 2060+30f1+70f2 |
Now, ![]() and
and ![]()
![]()
from (i)
![]()
using (i) and (ii)

Calculate the mean of the distribution, given below, using the short cut method :
Mark | 11-20 | 21-30 | 31-40 | 41-50 | 51-60 | 61-70 | 71-80 |
No. of students | 2 | 6 | 10 | 12 | 9 | 7 | 4 |

No comments:
Post a Comment