Draw histogram for the following distributions:
(i)
Class Interval | 0-10 | 10-20 | 20-30 | 30-40 | 40-50 | 50-60 |
Frequency | 12 | 20 | 26 | 18 | 10 | 6 |
(ii)
Class Interval | 10-16 | 16-22 | 22-28 | 28-34 | 34-40 |
Frequency | 15 | 23 | 30 | 20 | 16 |
(iii)
Class Interval | 30-39 | 40-49 | 50-59 | 60-69 | 70-79 |
Frequency | 24 | 16 | 09 | 15 | 20 |
(iv)
Class Marks | 16 | 24 | 32 | 40 | 48 | 56 | 64 |
Frequency | 8 | 12 | 15 | 18 | 25 | 19 | 10 |
(i)
Class Interval | Frequency |
0-10 | 12 |
10-20 | 20 |
20-30 | 26 |
30-40 | 18 |
40-50 | 10 |
50-60 | 06 |
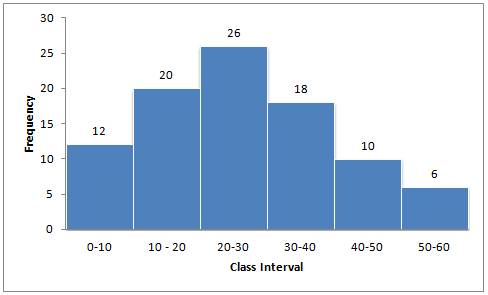
Steps of construction:
(a) Taking suitable scales, mark class intervals on x-axis and frequency on y-axis.
(b)Construct rectangles with class intervals as bases and corresponding frequencies as heights.
(ii)
Class Interval | Frequency |
10-16 | 15 |
16-22 | 23 |
22-28 | 30 |
28-34 | 20 |
34-40 | 16 |
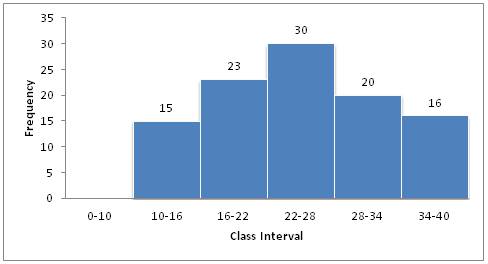
Steps of construction:
(a) Taking suitable scales, mark class intervals on x-axis and frequency on y-axis.
(b) Construct rectangles with class intervals as bases and corresponding frequencies as heights.
(iii)
Class Interval (Inclusive form) | Class Interval (Exclusive Form) | Frequency |
30-39 | 29.5-39.5 | 24 |
40-49 | 39.5-49.5 | 16 |
50-59 | 49.5-59.5 | 09 |
60-69 | 59.5-69.5 | 15 |
70-79 | 69.5-79.5 | 20 |
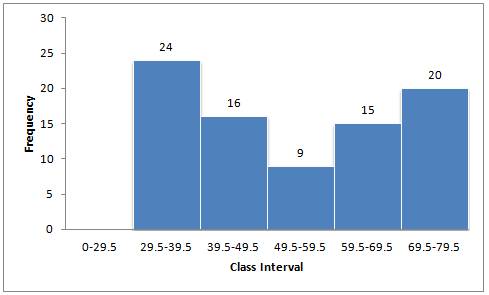
Steps of construction:
(a) Convert the data into exclusive form.
(b) Taking suitable scales, mark class intervals on x-axis and frequency on y-axis.
(c) Construct rectangles with class intervals as bases and corresponding frequencies as heights.
(iv)
Class Marks | Class Intervals | Frequency |
16 | 12-20 | 08 |
24 | 20-28 | 12 |
32 | 28-36 | 15 |
40 | 36-44 | 18 |
48 | 44-52 | 25 |
56 | 52-60 | 19 |
64 | 60-68 | 10 |
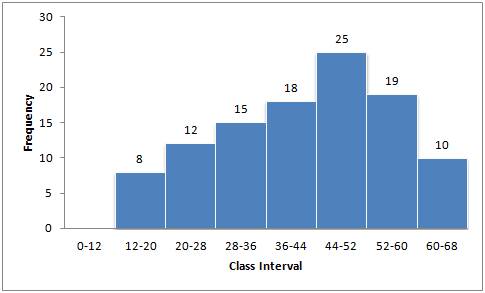
Steps of construction:
(a) Convert the class marks into class intervals.
(b) Taking suitable scales, mark class intervals on x-axis and frequency on y-axis.
(c) Construct rectangles with class intervals as bases and corresponding frequencies as heights.
Draw cumulative frequency curve (ogive) for each of the following distributions:
(i)
Class Interval | 10-15 | 15-20 | 20-25 | 25-30 | 30-45 | 35-40 |
Frequency | 10 | 15 | 17 | 12 | 10 | 08 |
(ii)
Class Interval | 10-19 | 20-29 | 30-39 | 40-49 | 50-59 |
Frequency | 23 | 16 | 15 | 20 | 12 |
(i)
Class Interval | Frequency |
10-15 | 10 |
15-20 | 15 |
20-25 | 17 |
25-30 | 12 |
30-35 | 10 |
35-40 | 08 |
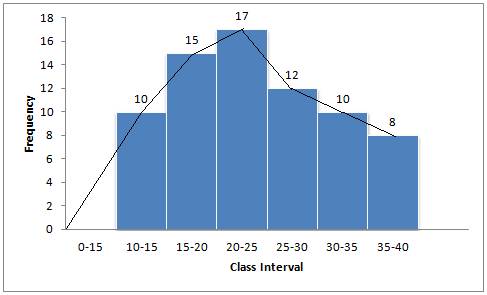
Steps of construction:
(a) Taking suitable scales, mark class intervals on x-axis and frequency on y-axis.
(b) Construct rectangles with class intervals as bases and corresponding frequencies as heights.
( c) Join the mid-points of the rectangle to obtain the ogive.
(ii)
Class Interval (Inclusive) | Class Interval (Exclusive) | Frequency | Cumulative Frequency |
10-19 | 9.5-19.5 | 23 | 23 |
20-29 | 19.5-29.5 | 16 | 39 |
30-39 | 29.5-39.5 | 15 | 54 |
40-49 | 39.5-49.5 | 20 | 74 |
50-59 | 49.5-59.5 | 12 | 86 |
Total | 86 |
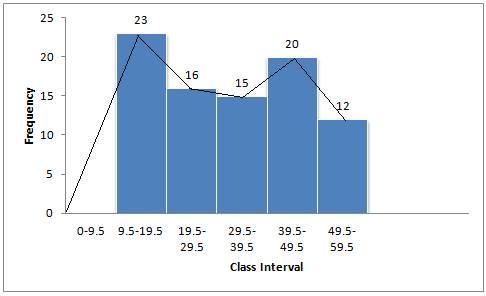
Steps of construction:
(a) Convert the data into exclusive form.
(b) Taking suitable scales, mark class intervals on x-axis and frequency on y-axis.
(c) Construct rectangles with class intervals as bases and corresponding frequencies as heights.
(d) Join the mid-points of the rectangle to obtain the ogive.
Draw an ogive for each of the following distributions:
(i)
Marks Obtained | less than 10 | less than 20 | less than30 | less than 40 | less than 50 |
No. of Students | 8 | 25 | 38 | 50 | 67 |
(ii)
Age in years (less than) | 10 | 20 | 30 | 40 | 50 | 60 | 70 |
Cumulative Frequency | 0 | 17 | 32 | 37 | 53 | 58 | 65 |
(i)
Marks Obtained | No. of students (c.f.) |
less than 10 | 8 |
less than 20 | 25 |
less than 30 | 38 |
less than 40 | 50 |
less than 50 | 67 |
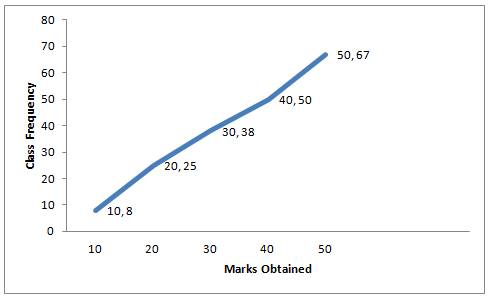
Steps Of construction:
(a) Plot the points (10,8), (20, 25), (30, 38), (40, 50) and (50, 67) on the graph.
(b) Join them with free hand to obtain an ogive.
(ii)
Age in years (less than) | Cumulative Frequency |
10 | 0 |
20 | 17 |
30 | 32 |
40 | 37 |
50 | 53 |
60 | 58 |
70 | 65 |
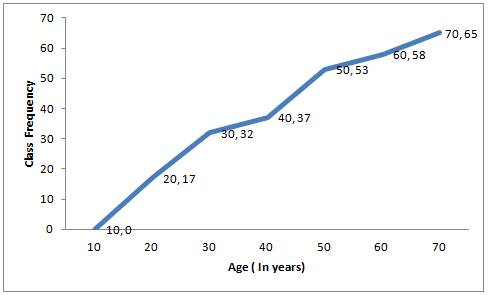
Steps Of construction:
(a) Plot the points (10, 0), (20, 17), (30, 32), (40, 37), (50, 53), (60, 58) and (70, 65) on the graph.
(b) Join them with free hand to obtain an ogive.
Construct a frequency distribution table for the number given below, using the class intervals 21-30, 31-40 … etc.
75, 67, 57, 50, 26, 33, 44, 58, 67, 75, 78, 43, 41, 31, 21, 32, 40, 62, 54, 69, 48, 47, 51, 38, 39, 43, 61, 63, 68, 53, 56, 49, 59, 37, 40, 68, 23, 28, 36, 47
Use the table obtained to draw:
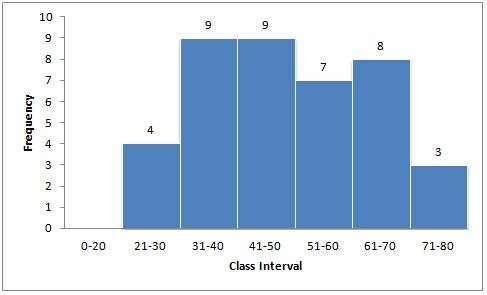
(i) a histogram (ii) an ogive
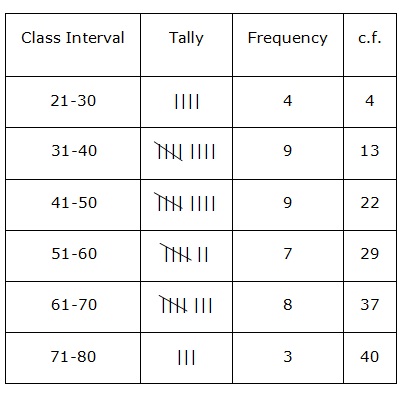
(i)
(ii)
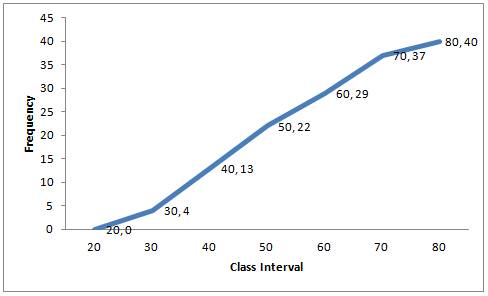
Plot the points (30,4), (40,13), (50,22), (60,29), (70,37) and (80,40) on the graph and join them with free hand to obtain an ogive.
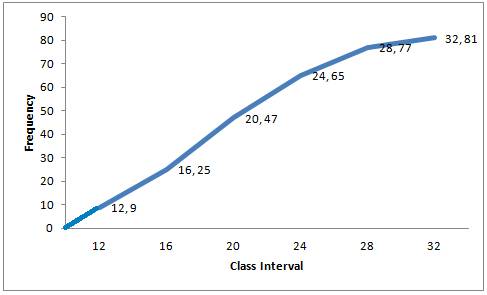
(a) Use information given in the adjoining histogram to construct a frequency table. 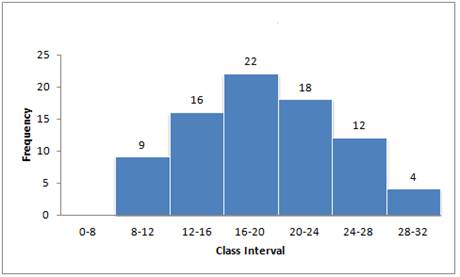
(b) Use this table to construct an ogive.
(a)
Class Interval | Frequency | c.f. |
8-12 | 9 | 9 |
12-16 | 16 | 25 |
16-20 | 22 | 47 |
20-24 | 18 | 65 |
24-28 | 12 | 77 |
28-32 | 4 | 81 |
(b) Now plot the points (12, 9), (16, 25), (20, 47), (24, 65), (28, 77), (32, 81) and join them to obtain an ogive.
Class Mark | 12·5 | 17·5 | 22·5 | 27·5 | 32·5 | 37·5 | 42·5 |
Frequency | 12 | 17 | 22 | 27 | 30 | 21 | 16 |
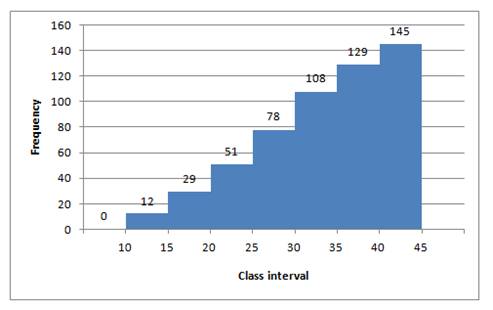
(a) From the distribution, given above, construct a frequency table.
(b) Use the table obtained in part (a) to draw: (i) a histogram, (ii) an
ogive.
(a)
Difference in consecutive class marks = 17.5 - 12.5 = 5
 first class interval will be 10-15 and so on.
Class Mark | Class Interval | Frequency | c.f. |
12.5 | 10-15 | 12 | 12 |
17.5 | 15-20 | 17 | 29 |
22.5 | 20-25 | 22 | 51 |
27.5 | 25-30 | 27 | 78 |
32.5 | 30-35 | 30 | 108 |
37.5 | 35-40 | 21 | 129 |
42.5 | 40-45 | 16 | 145 |
Total = 145
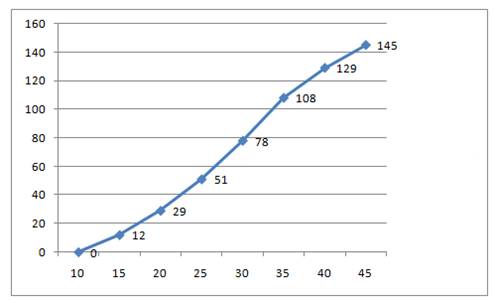
(b)
Now plot the points (15,12), (20,29), (25,51), (30,78), (35,108), (40,129), (45,145) and join them to obtain an ogive.
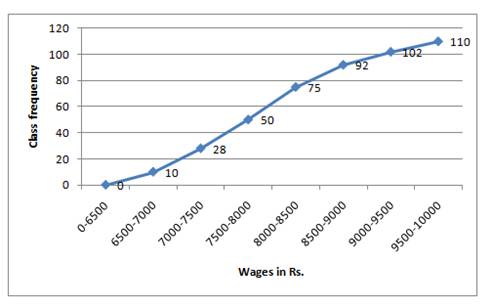
Use graph paper for this question.
The table given below shows the monthly wages of some factory workers.
(i) Using the table, calculate the cumulative frequencies of workers
(ii) Draw a cumulative frequency curve.
Use 2 cm = Rs 500, starting the origin at Rs 6500 on x-axis, and 2 cm = 10 workers on the y-axis.
Wages (in Rs) | 6500 - 7000 | 7000 - 7500 | 7500 - 8000 | 8000 - 8500 | 8500 - 9000 | 9000 - 9500 | 9500 - 10000 |
No. of workers | 10 | 18 | 22 | 25 | 17 | 10 | 8 |
(i)
Wages | No. Of workers | c.f. |
6500-7000 | 10 | 10 |
7000-7500 | 18 | 28 |
7500-8000 | 22 | 50 |
8000-8500 | 25 | 75 |
8500-9000 | 17 | 92 |
9000-9500 | 10 | 102 |
9500-10000 | 8 | 110 |
Total = 110
Now plot the points (7000,10), (7500,28), (8000,50), (8500,75), (9000,92), (9500,102) and (10000,110) and join them to obtain an ogive.
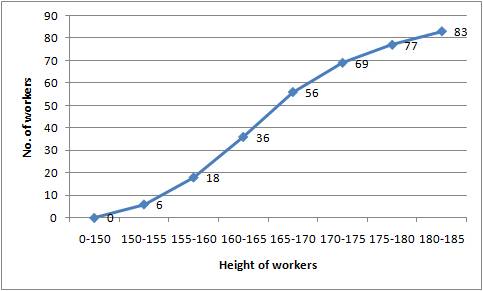
The following table shows the distribution of the heights of a
group of factory workers :
Ht.(cm): | 150 - 155 | 155 - 160 | 160 - 165 | 165 - 170 | 170 - 175 | 175 - 180 | 180 - 185 |
No. of | |||||||
workers: | 6 | 12 | 18 | 20 | 13 | 8 | 6 |
(i) Determine the cumulative frequencies.
(ii) Draw the 'less than' cumulative frequency curve on graph
paper. Use 2 cm = 5 cm height on one axis and 2 cm = 10
workers on the other.
Height (in cm) | No. Of workers | c.f. |
150-155 | 6 | 6 |
155-160 | 12 | 18 |
160-165 | 18 | 36 |
165-170 | 20 | 56 |
170-175 | 13 | 69 |
175-180 | 8 | 77 |
180-185 | 6 | 83 |
We plot the points (155, 6), (160, 18), (165, 36), (170, 56), (175, 69),
(180, 77) and (185, 83) on the graph and join them in free hand to obtain an ogive.
Construct a frequency distribution table for each of the following
distributions:
(i)
Marks (less than) | 0 | 10 | 20 | 30 | 40 | 50 | 60 | 70 | 80 | 90 | 100 |
Cumulative | 0 | 7 | 28 | 54 | 71 | 84 | 105 | 147 | 180 | 196 | 200 |
Frequency |
(ii)
Marks (more than) | 0 | 10 | 20 | 30 | 40 | 50 | 60 | 70 | 80 | 90 | 100 |
Cumulative Frequency | 100 | 87 | 65 | 55 | 42 | 36 | 31 | 21 | 18 | 7 | 0 |
(i)
Marks (less than) | Cumulative frequency | Frequency |
0-10 | 7 | 7 |
10-20 | 28 | 28-7=21 |
20-30 | 54 | 54-28=26 |
30-40 | 71 | 71-54=17 |
40-50 | 84 | 84-71=13 |
50-60 | 105 | 105-84=21 |
60-70 | 147 | 147-105=42 |
70-80 | 180 | 180-147=33 |
80-90 | 196 | 196-180=16 |
90-100 | 200 | 200-196=4 |
Total | 200 |
(ii)
Marks (more than) | Cumulative frequency | Frequency |
0-10 | 100 | 13 |
10-20 | 87 | 22 |
20-30 | 65 | 10 |
30-40 | 55 | 13 |
40-50 | 42 | 6 |
50-60 | 36 | 5 |
60-70 | 31 | 10 |
70-80 | 21 | 3 |
80-90 | 18 | 11 |
90-100 | 7 | 7 |
Total | 100 |
No comments:
Post a Comment