A student got the following marks in 9 questions of a question paper.
3, 5, 7, 3, 8, 0, 1, 4 and 6.
Find the median of these marks.
Arranging the given data in descending order:
8, 7, 6, 5, 4, 3, 3, 1, 0
The middle term is 4 which is the 5th term.
Median = 4
The weights (in kg) of 10 students of a class are given below:
21, 28.5, 20.5, 24, 25.5, 22, 27.5, 28, 21 and 24.
Find the median of their weights.
Arranging the given data in descending order:
28.5, 28, 27.5, 25.5, 24, 24, 22, 21, 21, 20.5
The middle terms are 24 and 24, 5th and 6th terms
![]()
The marks obtained by 19 students of a class are given below:
27, 36, 22, 31, 25, 26, 33, 24, 37, 32, 29, 28, 36, 35, 27, 26, 32, 35 and 28. Find:
(i) median
(ii) lower quartile
(iii) upper quartile
(iv) interquartile range
Arranging in ascending order:
22, 24, 25, 26, 26, 27, 27, 28, 28, 29, 21, 32, 32, 33, 35, 35, 36, 36, 37
(i) Middle term is 10th term i.e. 29
Median = 29
(ii) Lower quartile =

(iii) Upper quartile =

(iv) Interquartile range = q3 - q1 =35 - 26 = 9
From the following data, find:
(i) Median
(ii) Upper quartile
(iii) Inter-quartile range
25, 10, 40, 88, 45, 60, 77, 36, 18, 95, 56, 65, 7, 0, 38 and 83
Arrange in ascending order:
0, 7, 10, 18, 25, 36, 38, 40, 45, 56, 60, 65, 77, 83, 88, 95
(i) Median is the mean of 8th and 9th term
![]()
(ii) Upper quartile =

(iii) Interquartile range =

The ages of 37 students in a class are given in the following table:
Age (in years) | 11 | 12 | 13 | 14 | 15 | 16 |
Frequency | 2 | 4 | 6 | 10 | 8 | 7 |
Find the median.
Age (in years) | Frequency | Cumulative Frequency |
11 | 2 | 2 |
12 | 4 | 6 |
13 | 6 | 12 |
14 | 10 | 22 |
15 | 8 | 30 |
16 | 7 | 37 |
Number of terms = 37
Median = ![]()
Median = 14
The weight of 60 boys are given in the following distribution table:
Weight (kg) | 37 | 38 | 39 | 40 | 41 |
No. of boys | 10 | 14 | 18 | 12 | 6 |
Find:
(i) median
(ii) lower quartile
(iii) upper quartile
(iv) interquartile range
Weight (kg) x | no. of boys f | cumulative frequency |
37 | 10 | 10 |
38 | 14 | 24 |
39 | 18 | 42 |
40 | 12 | 54 |
41 | 6 | 60 |
Number of terms = 60
(i) median = the mean of the 30th and the 31st terms
![]()
(ii) lower quartile (Q1) = ![]()
(iii) upper quartile (Q3) = ![]()
(iv) Interquartile range = Q3 - Q1 = 40 - 38 = 2
Estimate the median for the given data by drawing an ogive:
Class | 0-10 | 10-20 | 20-30 | 30-40 | 40-50 |
frequency | 4 | 9 | 15 | 14 | 8 |
Class | Frequency | Cumulative Frequency |
0-10 | 4 | 4 |
10-20 | 9 | 13 |
20-30 | 15 | 28 |
30-40 | 14 | 42 |
40-50 | 8 | 50 |
Number of terms = 50
![]()
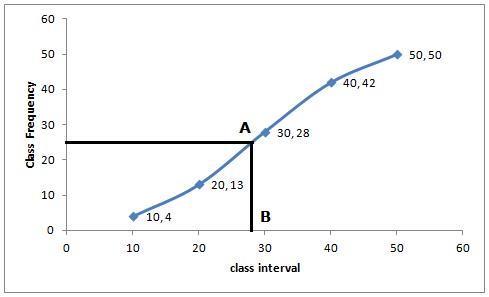
Through mark of 25.5 on the y-axis, draw a line parallel to x-axis which meets the curve at A. From A, draw a perpendicular to x-axis, which meets x-axis at B.
The value of B is the median which is 28.
By drawing an ogive, estimate the median for the following frequency distribution:
Weight (kg) | 10-15 | 15-20 | 20-25 | 25-30 | 30-35 |
No. of boys | 11 | 25 | 12 | 5 | 2 |
Weight (kg) | No. of boys | Cumulative Frequency |
10-15 | 11 | 11 |
15-20 | 25 | 36 |
20-25 | 12 | 48 |
25-30 | 5 | 53 |
30-35 | 2 | 55 |
Number of terms = 55
![]()
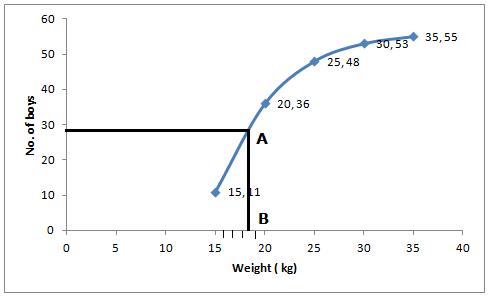
Through mark of 28 on the y-axis, draw a line parallel to x-axis which meets the curve at A. From A, draw a perpendicular to x-axis, which meets x-axis at B.
The value of B is the median which is 18.4 kg
From the following cumulative frequency table, find:
(i) median
(ii) lower quartile
(iii) upper quartile
Marks(less than) | 10 | 20 | 30 | 40 | 50 | 60 | 70 | 80 | 90 | 100 |
Cumulative frequency | 5 | 24 | 37 | 40 | 42 | 48 | 70 | 77 | 79 | 80 |
Marks (less than) | Cumulative frequency |
10 | 5 |
20 | 24 |
30 | 37 |
40 | 40 |
50 | 42 |
60 | 48 |
70 | 70 |
80 | 77 |
90 | 79 |
100 | 80 |
Number of terms = 80
\Median = 40th term.
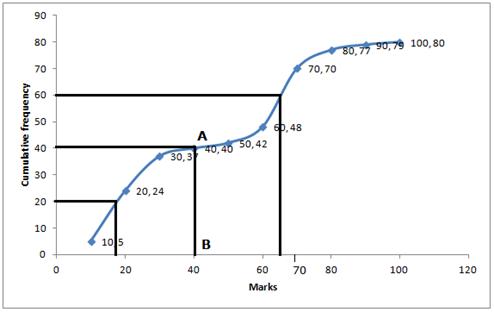
(i) Median = Through 40th term mark draw a line parallel to the x-axis which meets the curve at A. From A, draw a perpendicular to x-axis which meets it at B.
Value of B is the median = 40
(ii) Lower quartile (Q1) = 20th term = 18
(iii) Upper Quartile (Q3) = 60th term = 66
In a school, 100 pupils have heights as tabulated below:
Height (in cm) | No. of pupils |
121 - 130 | 12 |
131 - 140 | 16 |
141 - 150 | 30 |
151 - 160 | 20 |
161 - 170 | 14 |
171 - 180 | 8 |
Find the median height by drawing an ogive.
Height (in cm) | No. of pupils | Cumulative Frequency |
121 - 130 | 12 | 12 |
131 - 140 | 16 | 28 |
141 - 150 | 30 | 58 |
151 - 160 | 20 | 78 |
161 - 170 | 14 | 92 |
171 - 180 | 8 | 100 |
Number of terms = 100
![]()
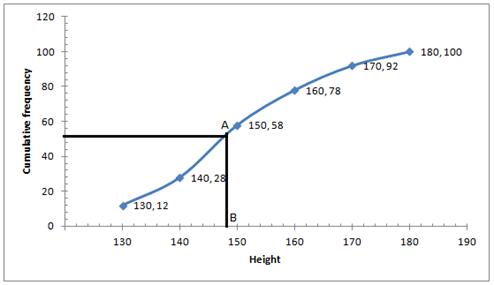
Through 50th term mark draw a line parallel to the x-axis which meets the curve at A. From A, draw a perpendicular to x-axis which meets it at B.
Value of B is the median = 148
 Median height = 148cm
No comments:
Post a Comment